Posts

The Algebra of Functions: Algebra Chapter 2 Section 6
Image
Hello internet, and welcome to the Algebra Lecture Series from the Science of Life.  This time, we are focusing on an introduction to the algebra of functions, or taking two or more functions and applying the algebraic functions in order to combine these functions. If we have two functions $f(x)$ and $g(x)$ which have the same domain, then applying the same x-value to them and performing a mathematical operation on them yields a single value.  It is important that they either have the same domain or have overlapping domain, since this is the only way that there would be a non-zero value for each function.  For example, a florist cannot physically store a negative quantity of flowers nor an amount of flowers greater than the physical space available.  Therefor, the domain is from 0 to some finite number determined by the physical space.  The same applies for other plants.  So flowers and plants have the same domain. One mechanism for applying an oper...
Other Equations of Lines: Algebra Chapter 2 Section 5

Image
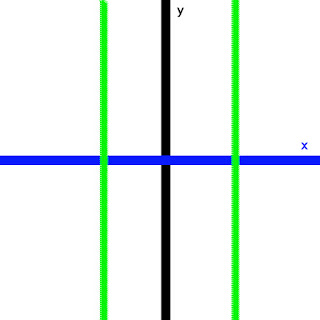
Hello internet, and welcome to the Algebra Lecture Series from The Science of Life.  This entry is focusing a little deeper into the concept of lines, especially the other equations of the line. Suppose that we have a line with slope $m$ and it passes through a specific point $(x_{1}, y_{1})$.  For any other general point (x, y) on the line (where $x_{1} \neq x$ and $y_{1} \neq y$) on the line, the slope of the line would be $m=\frac{y-y_{1}}{x-x_{1}}$.  Multiplying both sides of the equation by the denominator of the right hand side gives us $m \times (x-x_{1})=(y-y_1)$.  This final form is called the point-slope form of the linear equation, since we use a point and the slope. The two green lines are parallel. If we look at two parallel lines, they do not cross (they have no solution) by the definition of parallel lines.  This can only be done if the change in the y variable (the rise) for every unit change in the x variable are exactly the same ...

Another Look at Linear Equations: Algebra Chapter 2 Section 4

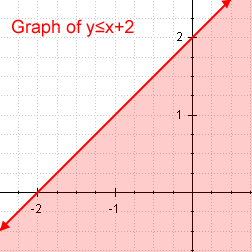
Hello internet, and welcome to the Algebra Lecture Series from The Science of Life.  This entry is an introduction to Linear Functions in both graphs and models. There are two situations where the slope would not be stated in the slope-intercept form.  These are cases where the line crosses only one of the 2 (or more) axes. First, let's consider the horizontal line.  If we have a line which has a y-intercept but does not have an x-intercept (does not cross the x-axis), it is called a horizontal line.  Let's look at it from the point of view of the slope-intercept form we developed last time, $y=mx+b$.  We know that the slope is the change in the y-value per change in the x-value.  If we have two points $(x_{1}, y_{1})$ and $(x_{2}, y_{2})$, the slope is mathematically defined as $m=\frac{y2-y1}{x2-x1}$.  The denominator, the $ dx=x2-x1$, is never going to be zero when there's a y-intercept, since we can go from the left of the y-intercept to th...

Linear Functions: Graphs and Models: The Algebra Lecture Series Chapter 2 Section 3

Image
Hello internet, and welcome to the Algebra Lecture Series from The Science of Life.  This entry is an introduction to Linear Functions in both graphs and models. Linear Equations are the easiest functions to conceptualize. They are lines which stretch out to infinity in both directions. On an x-y plane, the equation of a line can follow many forms, the first one usually introduced being the slope-intercept form y=mx+b, where m is the slope (change in the y-coordinate per 1 unit change in the x-coordinate) and b is the y-intercept (point where it crosses the y-axis). There are other forms of the equation of the line, but I'll get to those in future entries. If we have multiple points which form an obvious line, we can use two of those points to find the slope of the line. As mentioned earlier, the slope is the motion along the y-axis as the x-coordinate changes. With that in mind, we can use two points (x1, y1) and (x2, y2) to determine the slope. The slope is given by...

Algebra Chapter 2 Section 2: Functions

Image
Hello internet, and welcome to the Algebra Lecture Series from The Science of Life.  In this entry, we move to the definition of an algebraic function. I feel it is a good idea to start with the definitions of domain and range.  The domain is defined as the set of all possible values for which the independent variable (the input, the x-value) can take up.  This is all possible values for the horizontal (x) axis.  The range is the set of all possible values for which the dependent variable (the output, the y-value) can take up.  This is all possible values for the vertical (y) axis. The blue horizontal axis (typically the x-axis) is the domain and the independent variable. The green vertical axis (typically the y-axis) is the range and the dependent variable. Now we move to the concept of a function.  A good definition of the function is any equation where each input value has exactly one output value.  The technical version of this is "any eq...

An Introduction to Graphs: The Algebra Lecture Series Chapter 2 Section 1

Image
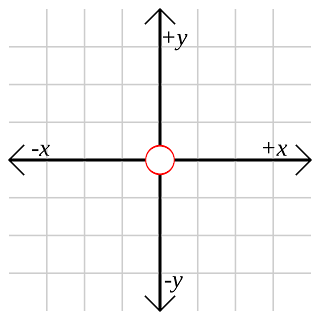
If you're familiar with a number line, then you know that each point on that number line corresponds to a number.  If we take two number lines which are perpindicular to one another (they cross each other to make a right angle) and have them cross at the others zero-point, then we have a method of analyzing two-dimensional data-sets and equations, data and equations with two variables which relate to one another.  This two-number-line situation is typically called either the x-y coordinate system (because the horizontal number line is labeled as the x-number line and the horizontal is labeled as the y-number-line) or the Cartessian Coordinate System (named after French mathematician René Descartes, supposedly the first person to come up with the system).  The two number lines, since they're in the context of a coordinate system, are each now called an axis (plural: axes). The x-axis and y-axis of a Cartesian coordinate system. Any point on this coordinate system i...

Chapter 2: Graphs, Functions, and Linear Equations

Image
Graphs are an important part of Algebra since they allow us to visualize information from the equations of Algebra.  After all, we deal better with the visual than the equation.  When we have an equation of two variables, we can see how they relate to one another more readily in a graph than in an equation. The course of Algebra focuses on the concept of functions (which will be defined in Section 2; because yes, functions are different than equations).  Most of the graphs considered here are what is called linear equations, equations which produce lines.  This chapter has the purpose of not only teaching the basics of graphing functions, but also using them for problem solving. Section 1: Graphs Section 2: Functions Section 3: Linear Functions: Graphs and Models Section 4: Other Equations of Line Section 5: Other Equations of Lines Section 6: The Algebra of Functions That's the end of this section.  If you have any questions, please leave ...